‘Microsoft Clarity’ now available to use!
To understand user behaviour and improve your site ranking, analytics is one of the most useful tools!
Microsoft has made available their free-to-use analytics product called ‘Clarity’ as part of their Webmaster Tools. This blog post will explain the benefits of using Clarity and how you can enable it.
Why use Clarity?
Easy to Use
Microsoft has designed Clarity so that it is able to be used no matter your skill level. The aim of the service is that it can be used by anyone wanting to improve their website experience!
Very low impact on your website
Clarity has been designed to have a very low impact on page load times. This means that users do not need to wait an extra amount of time for pages to load just because Clarity is being used.
No cap on user traffic
Clarity does not have a limit on the number of users who visit your site that it can analyse. This means regardless of whether you have 50 visitors or 100,000 visitors, Clarity will work the same.
What are some of the features of Clarity?
Heatmaps
Heatmaps allow you to see how users interact with your site visually. These come in two forms: clickmaps and scrollmaps!
Both of these data forms produce an easy-to-understand report which is then immediately actionable.
The major advantage of using heatmaps is that you are able to evidence user behaviour and trends with visual data. This can then be easily communicated to other people within the business – regardless of technical skill level!
If the results of the heatmaps and scrollmaps do not match up with what you expect, this can mean that changes need to be made.
Clickmaps
Clickmaps show you the content on your page that is important to users. It will show what website content is being interacted with the most – through the use of red and blue areas.
Scrollmaps
Scrollmaps show whether users are actually seeing the content that is important.
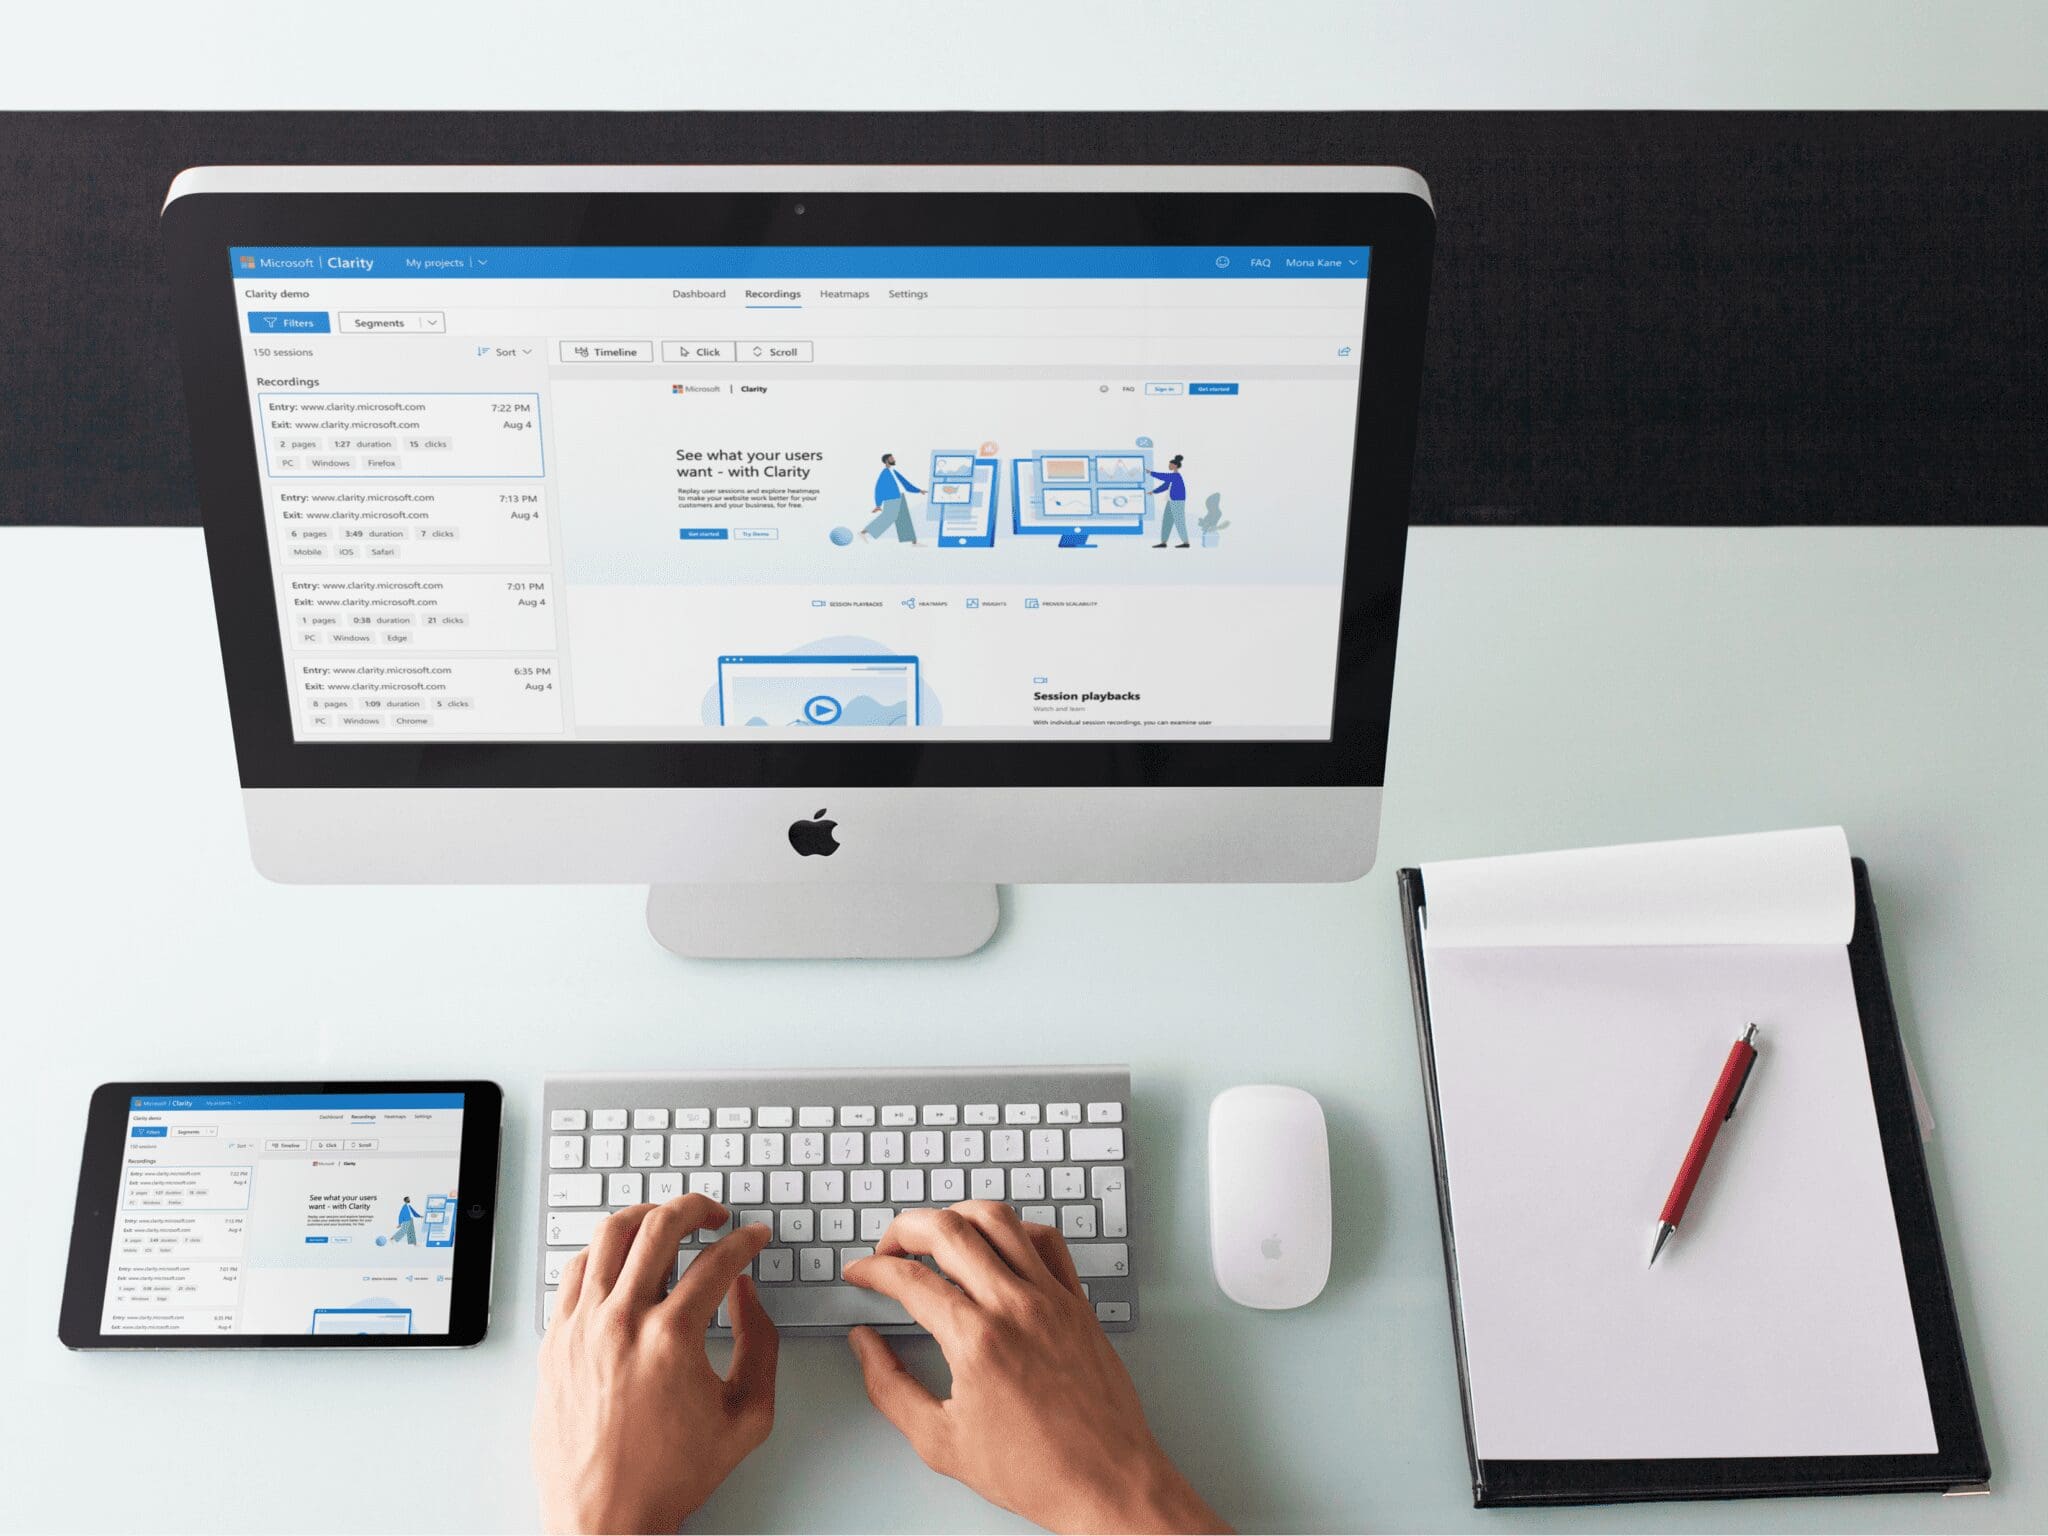
Session Playback
Clarity has session recording of visitors’ visits so that you can see whether your observations match your expectations!
The use of these recordings allows you to make data-driven decisions on if certain elements of your site are working as you expect and if you can make the experience better for your users.
Filtering Mechanism
You also have the ability to use the ‘filtering mechanism’. This will also you to really narrow down the recordings you use, so that you can make the best decisions possible for your site with optimal data.
There has also been machine learning used to figure out patterns of use such as “rage clicks”, “dead clicks” and “excessive scrolling”.
Rage clicks
The use of “rage clicks” is when a user clicks on a page several times where they think they should however there is no hyperlink or element present.
This can show that UI elements may not be as intuitive for users as expected and need to be changed.
Insights Dashboard
The Insights Dashboard can give you an overall understanding of website performance.
Some of what the dashboard can help you understand at a glance are:
- How many users were clicking on non-existent links
- How many scrolls up or down on a page and couldn’t find something
- Concurrent JavaScript errors on a page
- How much average time a user spends navigating your site
The statistics can also be filtered using the same tools available for session playback – so you are really able to drill down and get the optimal data for your particular user scenario!
Find out more about Clarity
You can find out more detail and see images of Clarity in action here.
How to use Clarity
In order to set up Clarity on your site, you can follow the instructions here.
Contact us here at O’Brien Media!
We are local web design specialists in Swindon, Wiltshire. If you want to diss anything web-related, please get in touch with one of our friendly team!